Real hardware evidence
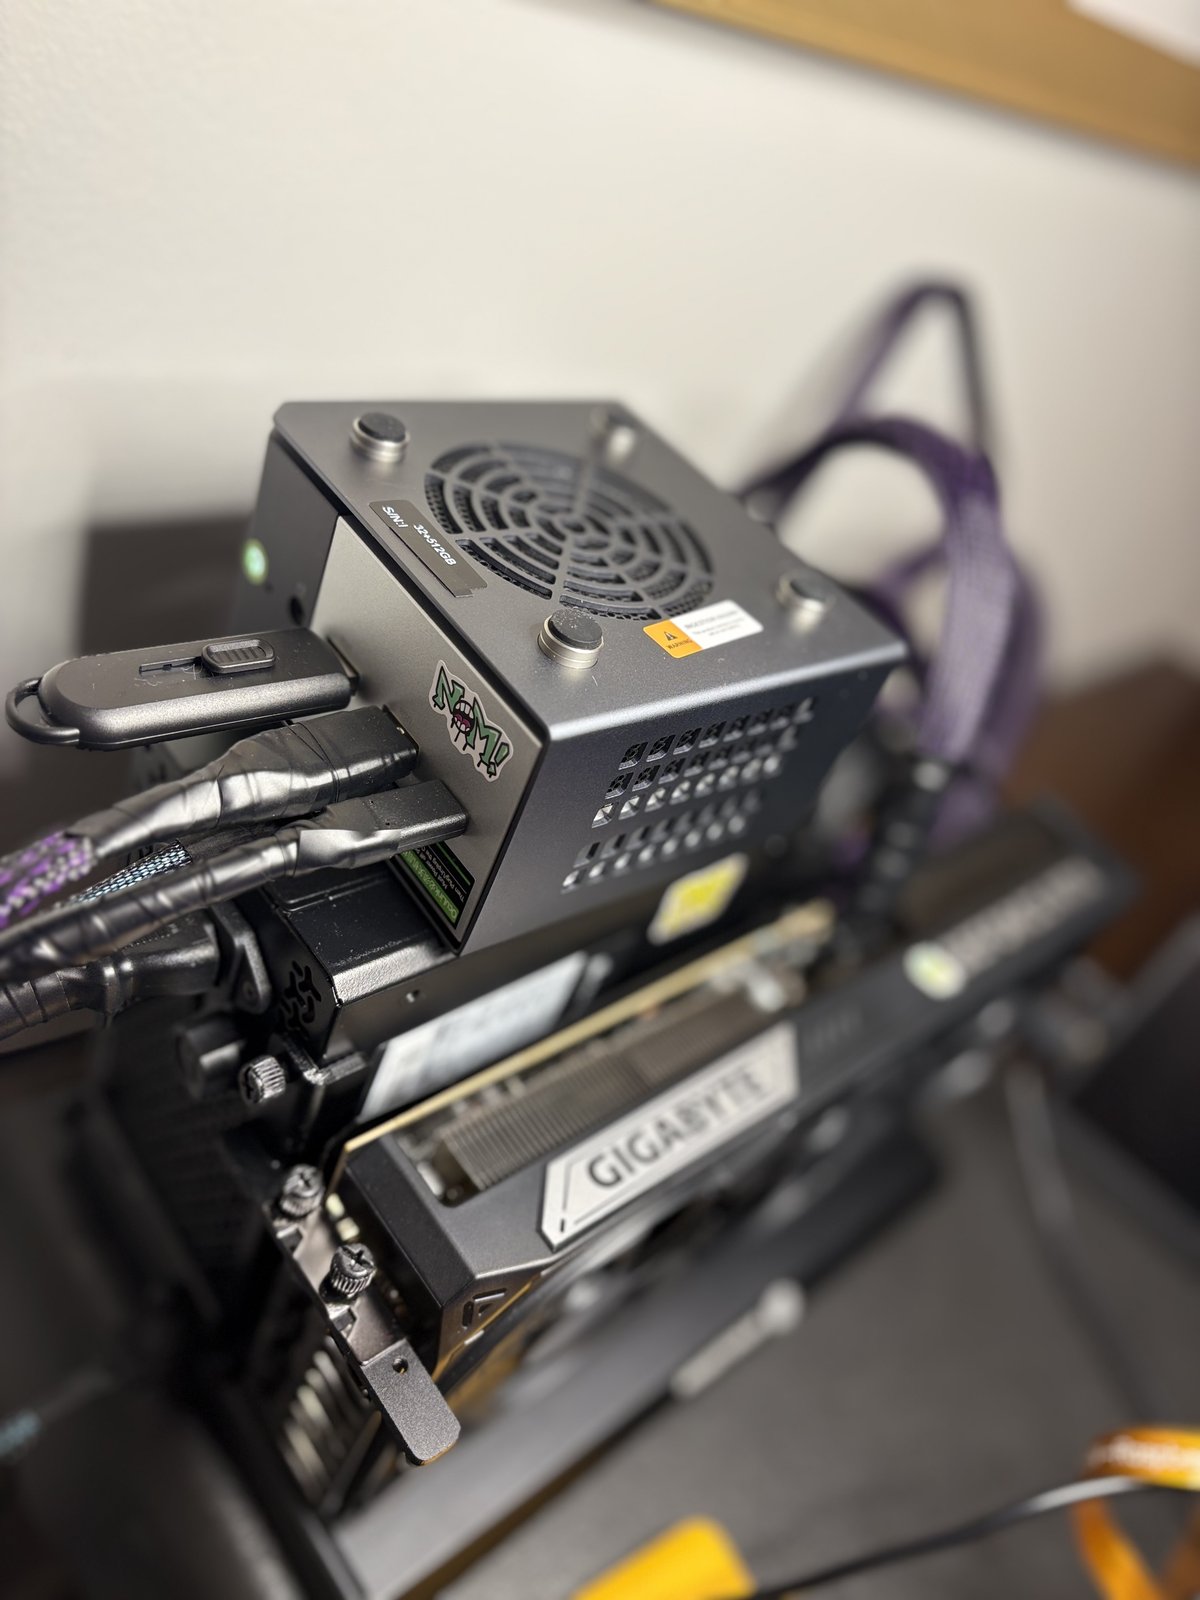
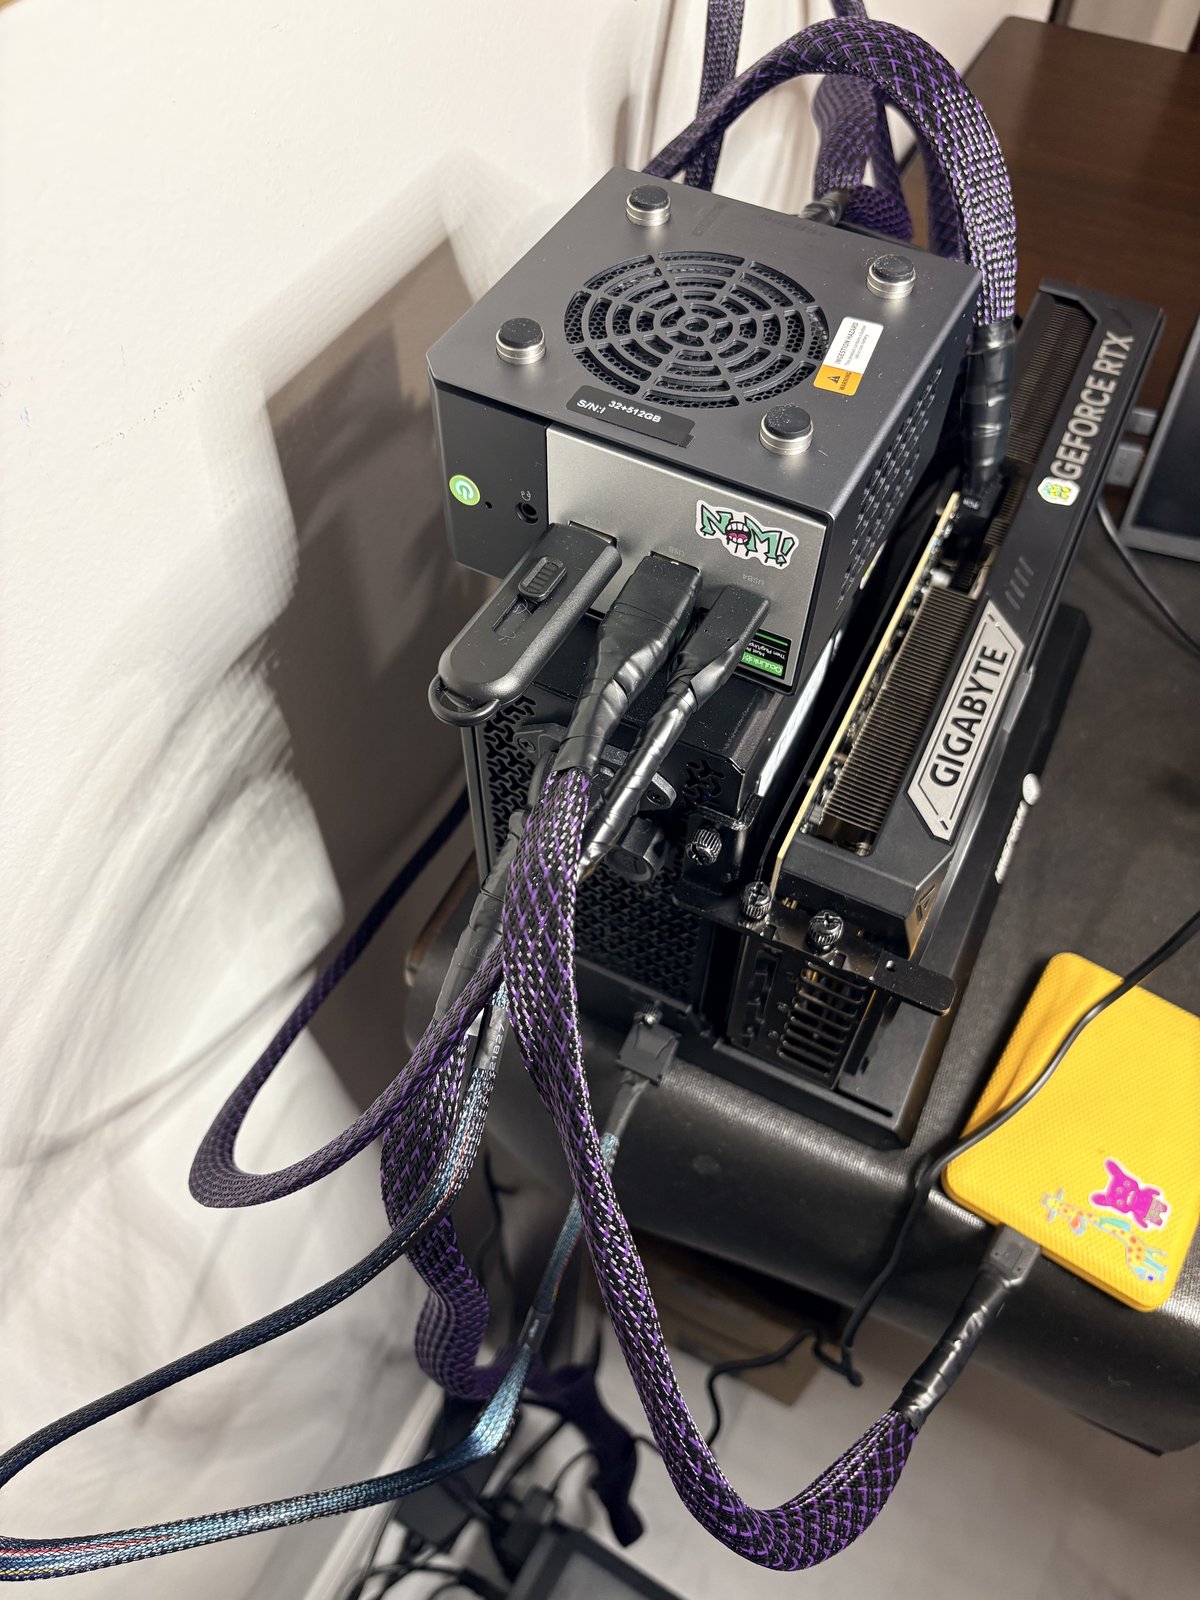
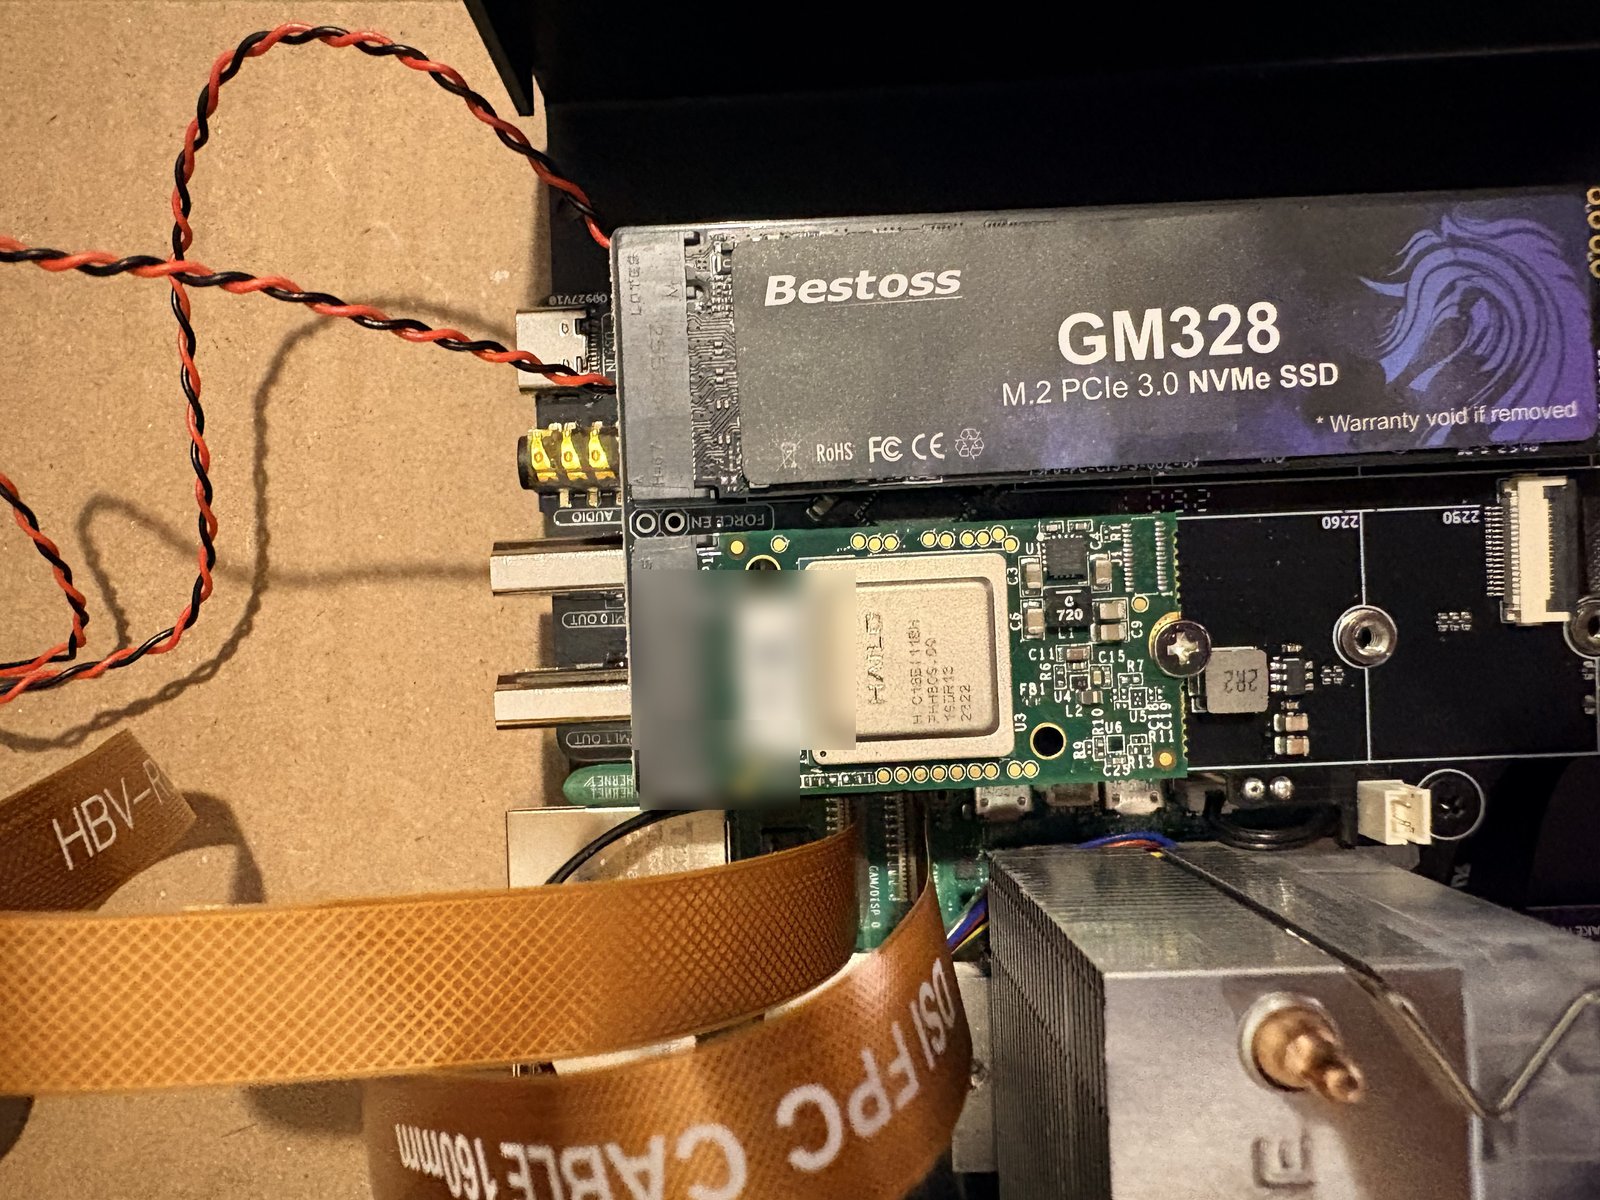
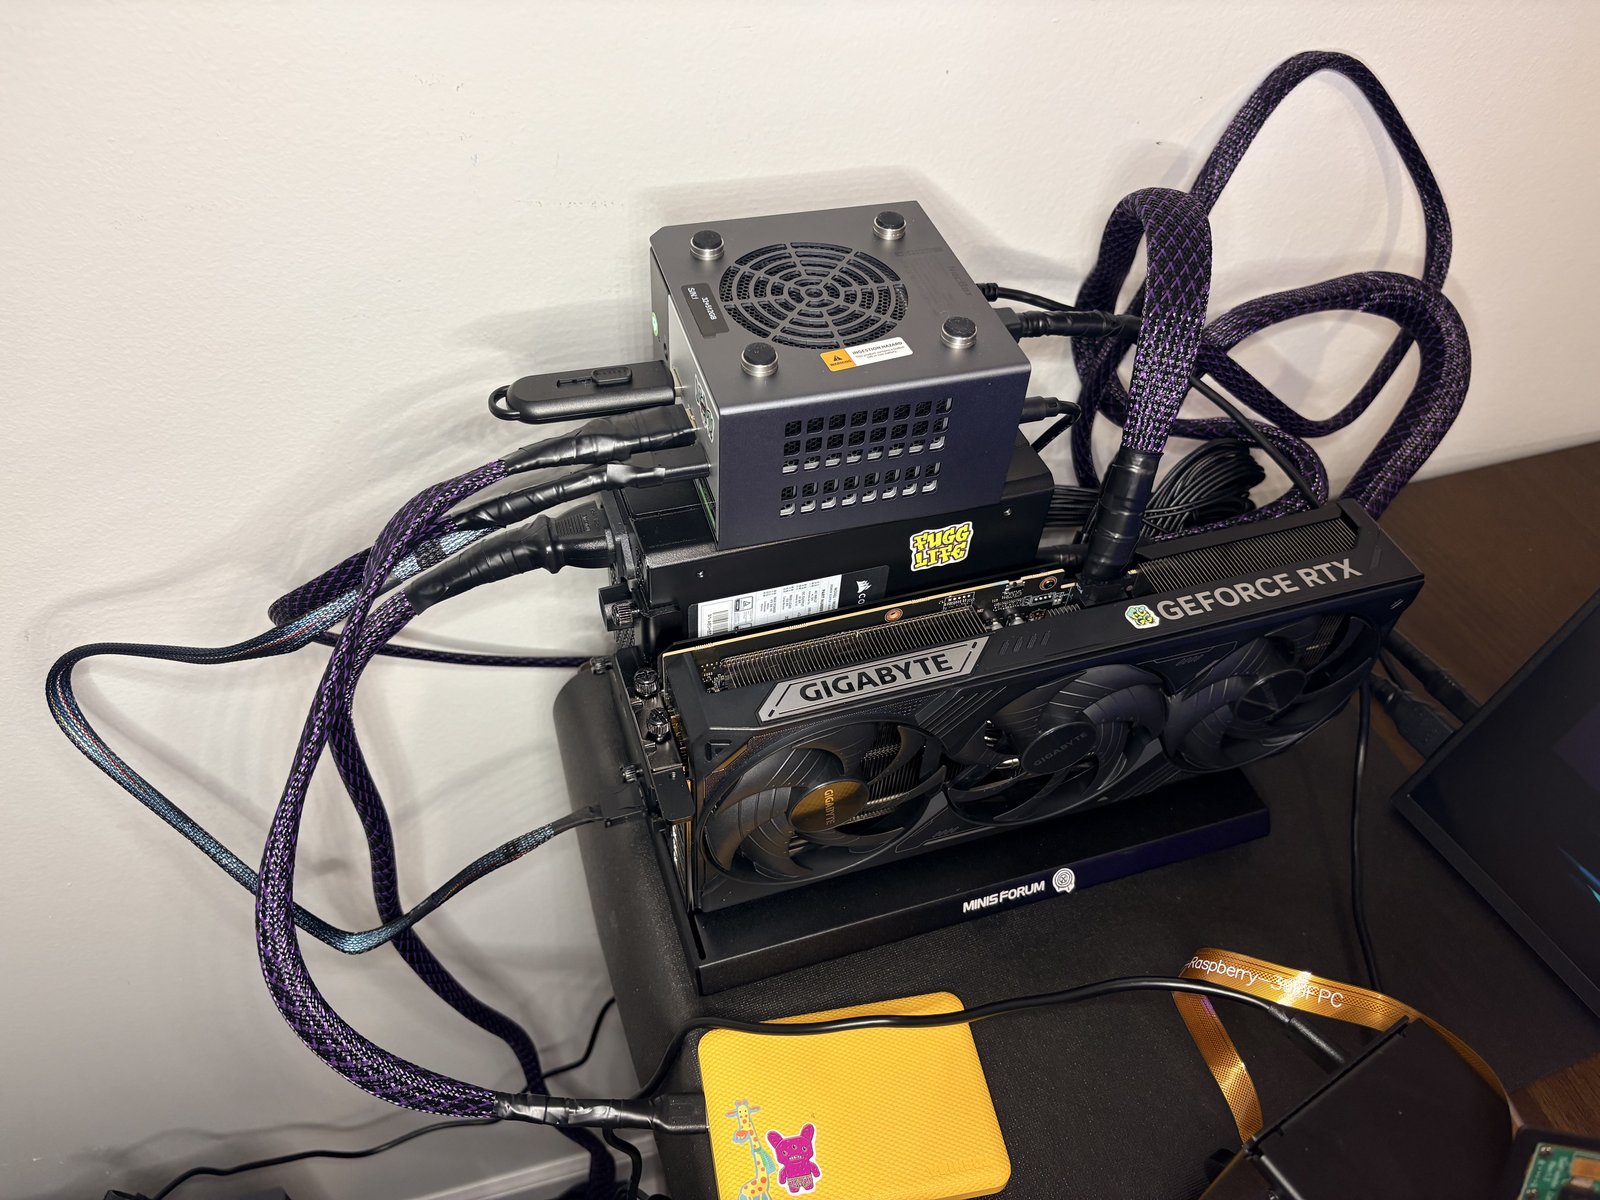
Stored hardware evidence from native-Ubuntu runs on the K16. Verified data only — every figure below is recorded bench output, not a projection. Hailo HEF compile + on-device load is now verified — see the gate result below.
exposed on native Ubuntu
tuned/lighter promoted
intensity pairs
blocked by safety gate
Recorded run logic
Claim firewall
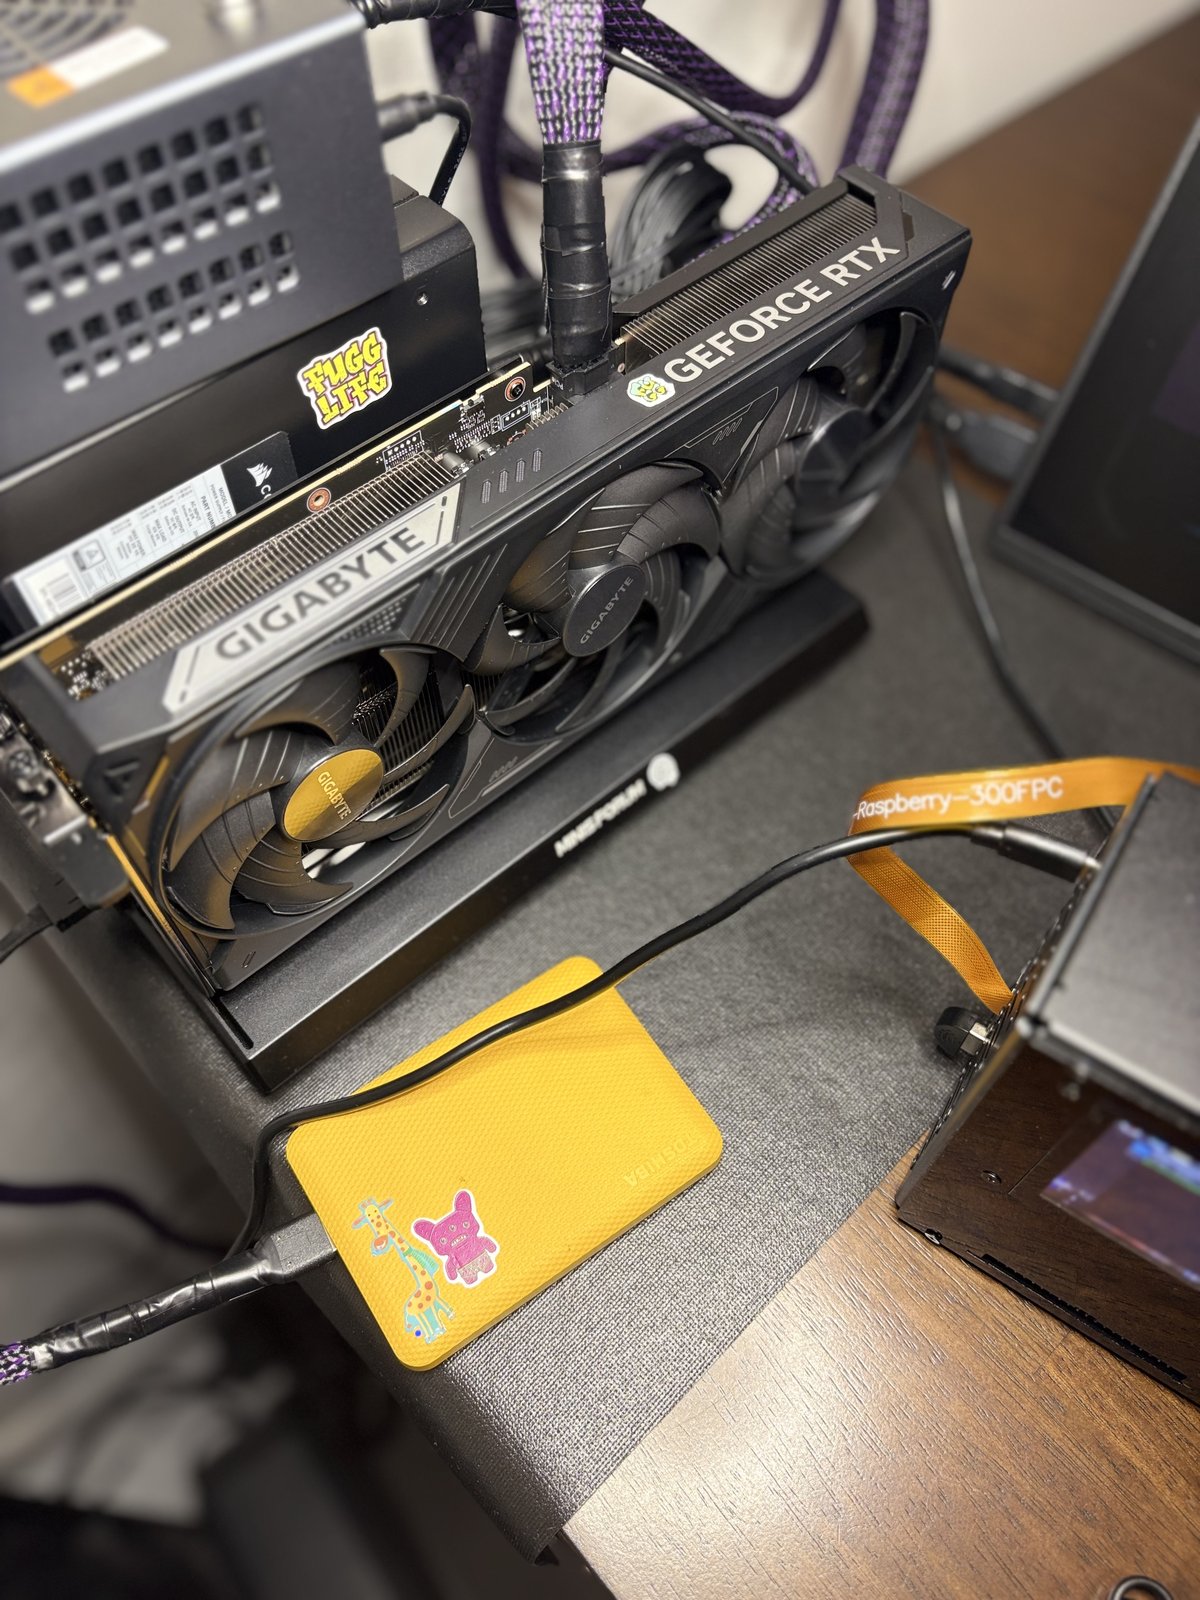
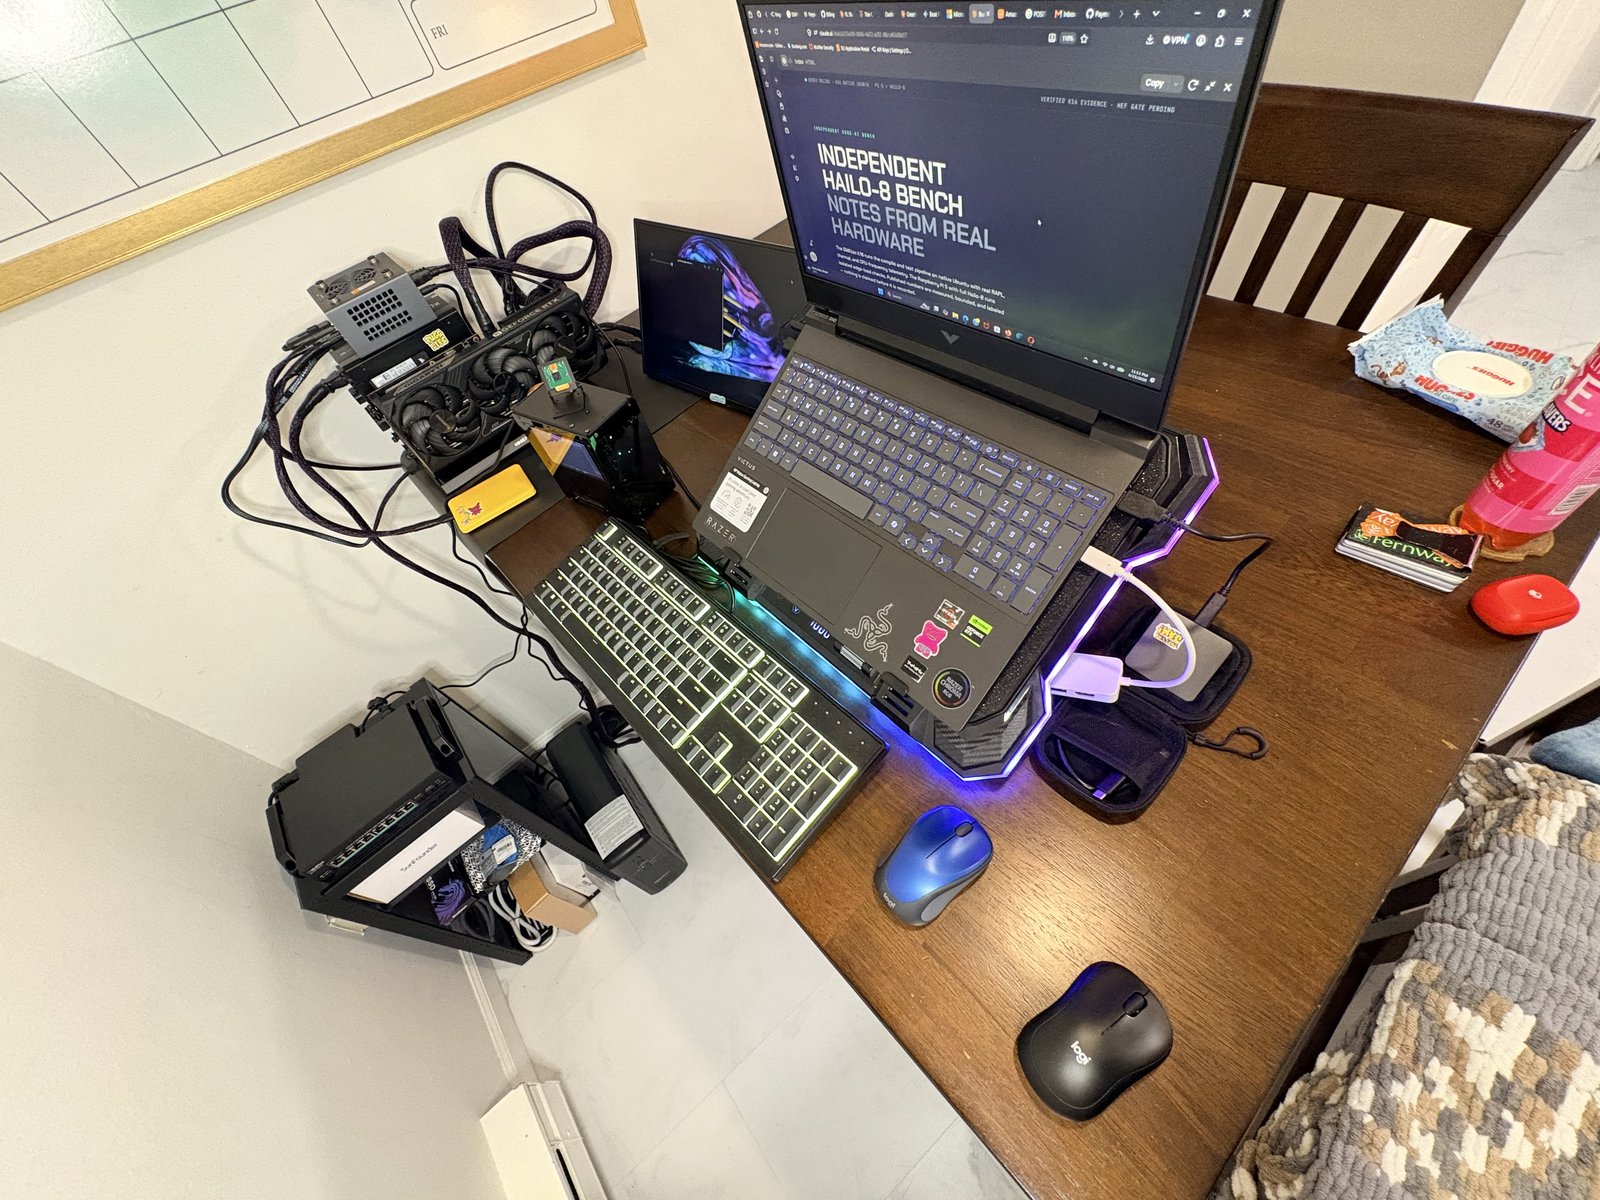
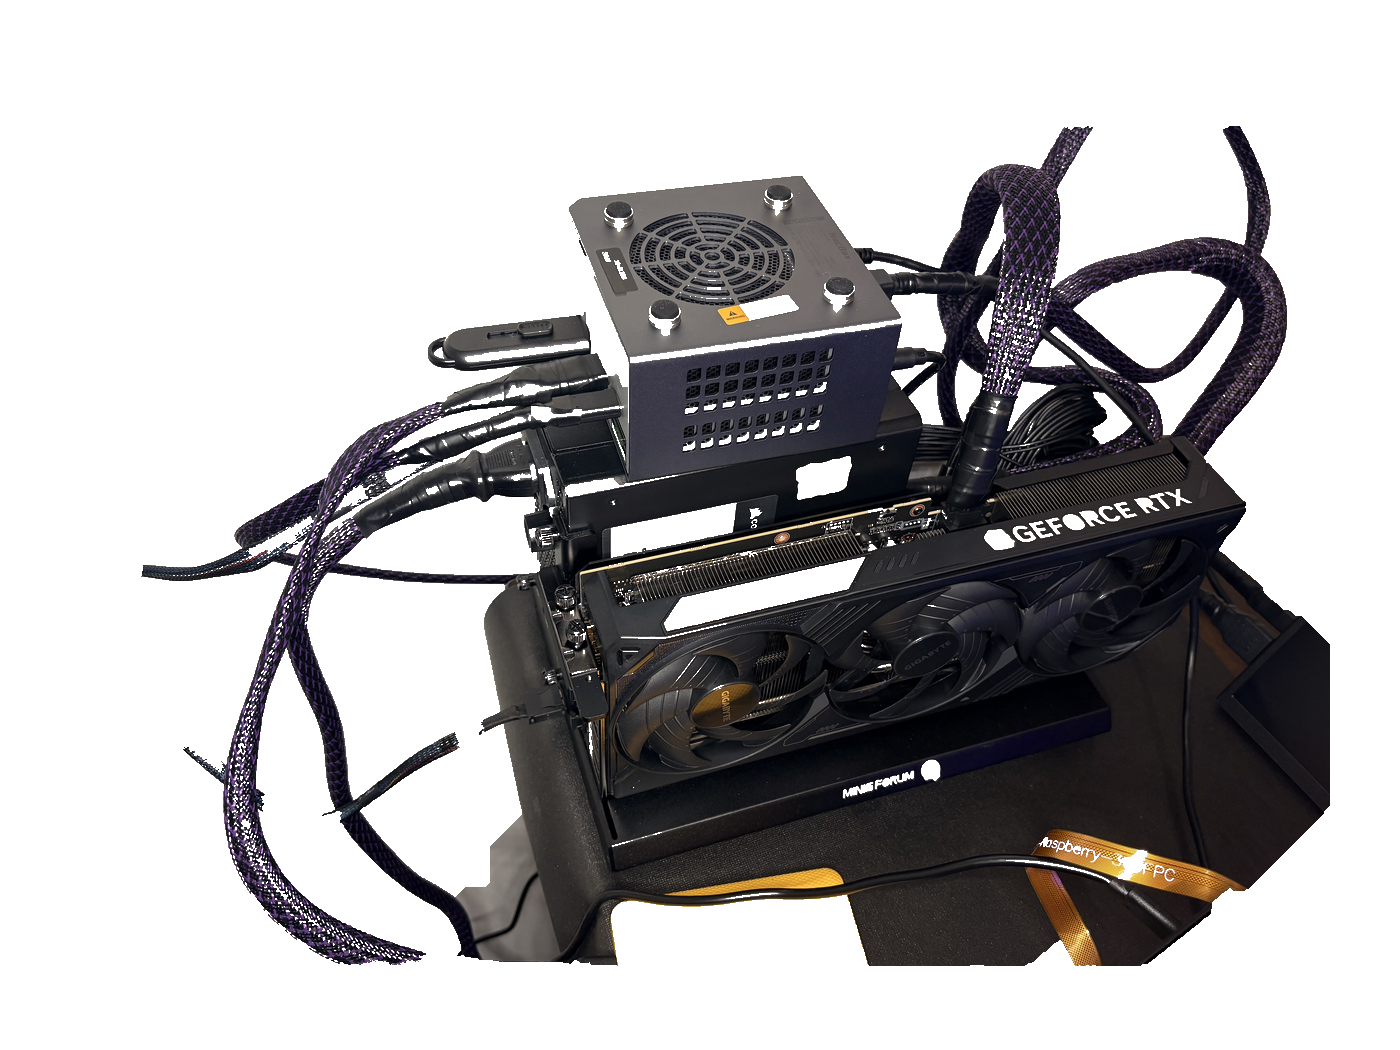
RTX 5070 Ti (Copperhead) — detection & CUDA capability gate. The eGPU is physically attached to the K16. Before any benchmark, the Blackwell sm_120 compute kernels are proven live with a real CUDA matmul — detection alone is not proof.
16,303 MiB VRAM
CUDA 13-era
kernels verified live
executed on device
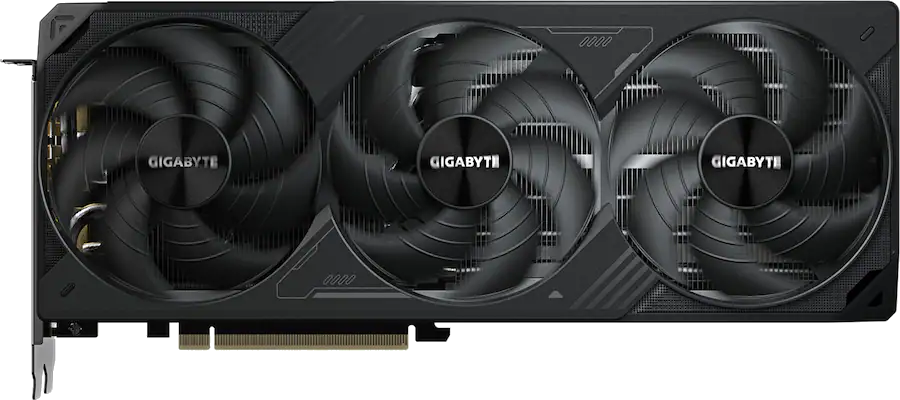
| Arch | Blackwell (sm_120) |
| Cores | 8,960 CUDA |
| VRAM | 16GB GDDR7 |
| Bus | 256-bit |
| Boost | 2,497 MHz |
| TDP | ~300 W |
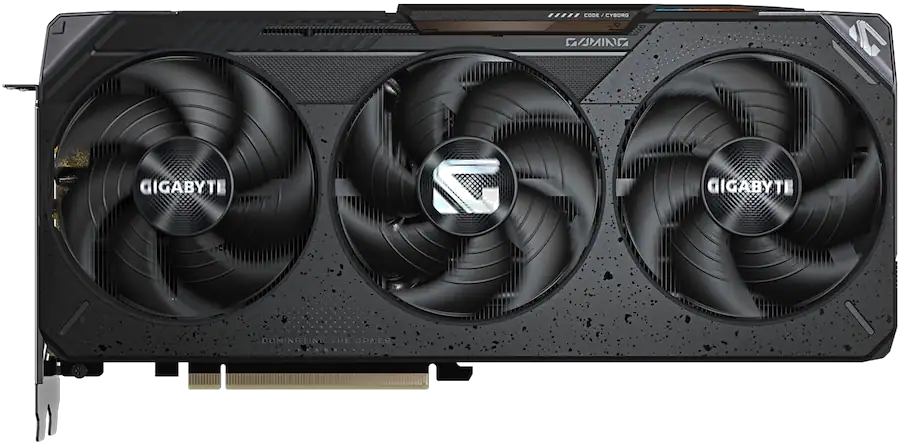
| Arch | RDNA 4 |
| Cores | 4,096 / 64 CU |
| VRAM | 16GB GDDR6 |
| Bus | 256-bit |
| Boost | 3,060 MHz |
| TDP | 304 W |
RTX 5070 Ti: verified, benchmarked below. RX 9070 XT: manufacturer spec, incoming hardware — not yet tested. Side-by-side is a roadmap, not a measured result.
giraffstack@Architrov:~$ nvidia-smi --query-gpu=name,driver_version,memory.total,temperature.gpu --format=csv
name, driver_version, memory.total [MiB], temperature.gpu
NVIDIA GeForce RTX 5070 Ti, 595.71.05, 16303 MiB, 35

giraffstack@Architrov:~$ python3 -c "import torch; ... ; x@x on cuda"
torch: 2.11.0+cu128
device: NVIDIA GeForce RTX 5070 Ti
capability: (12, 0)
CUDA matmul OK - sm_120 kernels live, result sum: 2000339456.0
Test 1 — device detection + sm_120 CUDA capability gate · recorded bench output
RTX 5070 Ti (Copperhead) — yolov8s fp16 @ 640, single-stream batch=1, raw PyTorch forward pass. This is the GPU running naive: one frame at a time, no batching, no engine optimization. The number it posts — and why it’s lower than you’d expect — sets up the two improvements that follow (TensorRT optimization, and batch scaling).
raw torch forward
single inference
of ~300 W ceiling
at batch=1
giraffstack@Architrov:~$ python3 bench_single.py   # live
  throughput   : 0.0 FPS
  mean latency : 0.00 ms
  GPU power    : 0.0 W
giraffstack@Architrov:~$ python3 bench_single.py   # yolov8s fp16 @ 640, batch=1
  model        : yolov8s.pt (fp16)
  resolution   : 640 x 640
  iterations   : 300 (after 30 warmup)
  mean latency : 5.77 ms
  throughput   : 172.7 FPS
  GPU power    : 66.2 W mean / 73.8 W peak
Test 2a — single-stream raw PyTorch baseline · recorded bench output
RTX 5070 Ti (Copperhead) — the optimized GPU artifact. Same yolov8s, compiled to a TensorRT engine (the CUDA equivalent of a Hailo HEF), FP16, tuned to this exact card. The payoff: a 3.3x jump over raw PyTorch, same silicon. Five runs with cooldown; median reported, full spread shown.
465-588 range
vs 5.77 raw
4.4x vs raw torch
tuned to sm_120
giraffstack@Architrov:~$ python3 trt_bench.py   # 5 runs + cooldown
  artifact     : yolov8s.engine (TensorRT 11.1, FP16)
  median FPS   : 0.0 FPS
  latency      : 0.00 ms
  perf/watt    : 0.0 FPS/W
giraffstack@Architrov:~$ yolo export model=yolov8s.pt format=engine half=True
  TensorRT: building FP16 engine as yolov8s.engine
  TensorRT: export success, saved as 'yolov8s.engine' (23.2 MB)
  Engine generation completed in 14.09 seconds.

  run 1: 565.5 FPS | run 2: 563.1 | run 3: 587.5 | run 4: 465.0 | run 5: 466.3
  MEDIAN: 563.1 FPS | 49.3 W | 11.09 FPS/W | range 465-588
Test 3 - yolov8s TensorRT engine - end-to-end, 5 runs + cooldown - recorded bench output
RTX 5070 Ti (Copperhead) — the compute ceiling. A raw fp16 matmul (8192×8192) pushes the silicon flat-out: 97 TFLOPS at 300 W peak. This is the number that explains the batch sweep — inference only ever reached 235 W, so it was bandwidth-bound, never compute-bound. The ALUs had more to give; yolov8s just couldn’t feed them fast enough.
3 runs, ±0.6
silicon ceiling
fp16 GEMM
at full tilt
giraffstack@Architrov:~$ python3 matmul_tflops.py   # 8192x8192 fp16, 3 runs
  run 1: 0.0 TFLOPS
  run 2: 0.0 TFLOPS
  run 3: 0.0 TFLOPS
  MEAN: 97.0 TFLOPS | 213.7 W mean / 300.0 W peak | 454 GFLOPS/W
Test 4 - raw fp16 matmul compute ceiling - 3 runs - recorded bench output
RTX 5070 Ti (Copperhead) — yolov8s fp16 @ 640, batch sweep 1→128, three runs per batch. The finding is the shape: throughput peaks at batch=16 then declines while power keeps climbing — the GPU saturates at 16, and bigger batches only add latency. Not VRAM-bound; compute-bound.
66.2 W
235.6 W
past this point
more power, less speed
giraffstack@Architrov:~$ python3 sweep.py   # yolov8s fp16 @ 640, 3 runs/batch
  batch   img/s      GPU W     img/s/W
      1     172.7      66.2       2.62
      8    1150.2     181.9       6.61
     16    1175.2     235.6       4.99   <- peak
     32    1098.7     253.9       4.33
     64    1016.4     258.8       3.93
    128     982.0     264.7       3.71
  PEAK THROUGHPUT: 1175.2 img/s at batch=16 (235.6W)
Test 2b — yolov8s CUDA batch sweep · mean of 3 runs each · recorded bench output
The A_SW anomaly engine, validated on real hardware (native Ubuntu, Live USB). 16 normal/tuned intensity pairs, each run five cycles. Green = selective (normal phase rejected all five, tuned promoted). Amber = review (normal did not reject all five) — marked honestly, not hidden. 13 of 16 selective is more credible than a clean 16; the boundary is where the method earns trust.
Three silicon targets, same yolov8s workload, all measured on real hardware. The result is not a single winner — it is two different races. The optimized GPU wins raw throughput; the edge accelerator wins efficiency by a wide margin at a fraction of the power. The right tool depends on what you are optimizing for.
| TARGET | PRECISION | FPS | POWER | FPS / W | BEST FOR |
|---|---|---|---|---|---|
| TensorRT (5070 Ti) | fp16 | 563 | 49 W | 11.5 | max throughput |
| Raw torch (5070 Ti) | fp16 | 173 | 66 W | 2.6 | baseline |
| CUDA peak (5070 Ti) | fp16 | 1175 | 236 W | 5.0 | batch=16 server |
| Hailo-8 (edge) | int8 | 220 | 3.25 W | 67.7 | efficiency / edge |
giraffstack@Architrov:~$ python3 summarize.py   # cross-target rollup
  throughput winner : TensorRT @ 0 FPS
  efficiency winner : Hailo-8 @ 0.0 FPS/W
  efficiency edge   : 0.0x vs optimized GPU, at 15x less power
Cross-target comparison - all values measured on real hardware. FPS bases differ slightly: Hailo = hailortcli streaming, TensorRT = end-to-end predict, raw torch = forward pass. Reported as measured, not normalized.
Idle-state GPU telemetry from the K16 / RTX 5070 Ti, captured with nvidia-smi dmon over 5 one-second samples on native Ubuntu. Recorded baseline — every figure below is measured output, not a projection. This is the resting floor the load benches climb from.
zero thermal drift
P8 low-power state
idle-gated
true resting floor
Recorded samples
What this proves
giraffstack@Architrov:~$ nvidia-smi dmon -c 5   # idle telemetry, 5 samples
  # gpu    pwr  gtemp     sm    mem   mclk   pclk
      0      3     35      0      0    405    180
      0      4     35      0      0    405    180
      0      5     35      0      0    405    180
      0      4     35      0      1    405    180
      0      4     35      0      0    405    180
Idle-state baseline - RTX 5070 Ti on the K16, native Ubuntu, nvidia-smi dmon, 5 one-second samples. Reported as measured, not normalized.
Load-state telemetry from the K16 / RTX 5070 Ti during a live llama3.1:8b generation, captured with nvidia-smi dmon on native Ubuntu. The idle→load delta below is the proof of engagement: clocks ramp 34x, power climbs 6–10x, while temp holds nearly flat. Compute throughput is measured separately at 143.35 tok/s. Recorded output, not a projection.
idle to load
sustained under gen
thermal headroom intact
measured separately
Idle → load delta
What this proves
giraffstack@Architrov:~$ nvidia-smi dmon -c 8   # during llama3.1:8b generation
  # gpu    pwr  gtemp     sm    mem   mclk   pclk
      0     30     36      2      0  13801   2505
      0     30     36      0      0  13801   2490
      0     29     36      0      0  13801   2490
      0     29     36      0      0  13801   2490
      0     29     36      0      0  13801   2490
      0     29     36      0      0  13801   2490
      0     29     36      0      0  13801   2490
      0     29     36      0      0  13801   2490
Load-state telemetry - RTX 5070 Ti on the K16 during llama3.1:8b generation. Clocks and power are the sustained-load measure; sm reads low because dmon 1s cadence undersamples sub-second token bursts - throughput (143 tok/s) is the compute proof. Reported as measured, not normalized.
Concurrent multi-model VRAM footprint on the K16 / RTX 5070 Ti, measured with ollama ps and nvidia-smi dmon on native Ubuntu. Two production models held resident at once, both 100% on GPU — no CPU spillover. Recorded output, not a projection.
both 100% GPU
~50% of ceiling
room for a third
43°C
Resident models
What this proves
giraffstack@Architrov:~$ ollama ps   # two models held resident
  NAME               SIZE      PROCESSOR    CONTEXT
  llama3.1:8b        5.3 GB    100% GPU     4096
  llama3.2:latest    2.6 GB    100% GPU     4096
  giraffstack@Architrov:~$ nvidia-smi dmon -c 1   # both loaded
  # gpu    pwr  gtemp   mclk   pclk
      0     73     43  13801   2895
Concurrent multi-model VRAM footprint - RTX 5070 Ti on the K16, native Ubuntu. Model sizes and GPU placement from ollama ps; power/temp/clocks from nvidia-smi dmon. Two production models resident simultaneously at 7.9 GB of 15.9 GB. Reported as measured, not normalized.
Raw compute throughput on the K16 / RTX 5070 Ti, measured directly with PyTorch 2.12 (cu128) on native Ubuntu — not inference, but bare matrix-multiply (GEMM) FLOPS. An 8192×8192 FP16 matmul, 3 warmup then 50 timed iterations, CUDA-synchronized. This is the silicon's raw compute ceiling, distinct from the img/s inference numbers elsewhere. Recorded output, not a projection.
8192³ matmul
8192×8192 FP16
RTX 5070 Ti
tensor path
Measured GEMM run
What this proves
giraffstack@Architrov:~$ python3 gemm_bench.py   # raw FP16 GEMM TFLOPS
  FP16 GEMM 8192x8192: 95.4 TFLOPS (11.52 ms/op)
  device: NVIDIA GeForce RTX 5070 Ti
  capability: (12, 0)
Raw compute throughput - RTX 5070 Ti on the K16, native Ubuntu, PyTorch 2.12 cu128. 8192x8192 FP16 GEMM, 3 warmup + 50 timed iterations, CUDA-synchronized. FLOPs = 2n³ per op. Reported as measured, not normalized.
Two measurements on the K16 / RTX 5070 Ti, native Ubuntu. Left: device memory bandwidth via PyTorch 2.12 (1 GB float32 copy). Right: a 60-second thermal soak under sustained llama3.1:8b load, sampled with nvidia-smi dmon every 5 seconds — the final sample caught the full compute burst at 250 W / 60°C. Recorded output, not a projection.
1 GB float32
50 timed iters
~23°C to throttle
full compute burst
Torch memory bandwidth
60s thermal soak
giraffstack@Architrov:~$ python3 bw_bench.py   # torch memory bandwidth
  device-to-device copy: 771.2 GB/s (2.78 ms/op)
  device: NVIDIA GeForce RTX 5070 Ti
  giraffstack@Architrov:~$ nvidia-smi dmon -c 12 -d 5   # 60s thermal soak, llama3.1:8b
  # gpu    pwr  gtemp     sm    mem   mclk   pclk
      0     17     43      0      0    810    495
      0     42     44      0      0  13801   2880
      0     31     44      0      0  13801   2490
      0     30     44      0      0  13801   2490
      0     35     44      0      0  13801   2505
      0     31     45      0      0  13801   2490
      0    250     60     91     80  13801   2865
Torch memory bandwidth + 60s thermal soak - RTX 5070 Ti on the K16, native Ubuntu. Bandwidth: 1 GB float32 device copy, PyTorch 2.12 cu128. Soak: nvidia-smi dmon, 12 samples over 60s under sustained llama3.1:8b load; peak sample 250 W / 60°C / sm 91%. Reported as measured, not normalized.
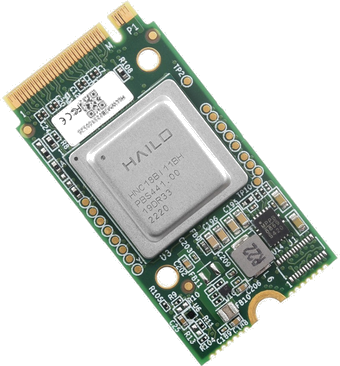
The fourth silicon target — queued, not yet tested. A 67-TOPS Tensor-core edge module that slots between the 3 W Hailo-8 and the 300 W desktop GPU. Where does it land on the throughput-vs-efficiency map? That is the next benchmark. Everything below is manufacturer spec; no workload has run on it yet.
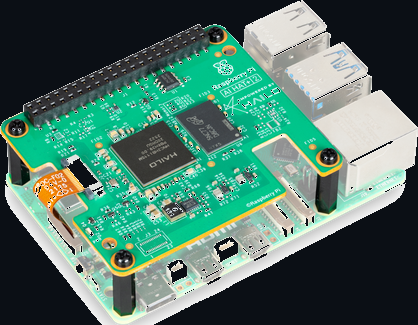
| Accelerator | Hailo-10H NPU |
| AI performance | 40 TOPS (INT4) |
| On-board RAM | 8 GB LPDDR4X (dedicated) |
| Power | ~2.5 W active inference |
| Interface | PCIe Gen 3 · Pi 5 HAT+ |
| New capability | local LLMs / VLMs on-chip |
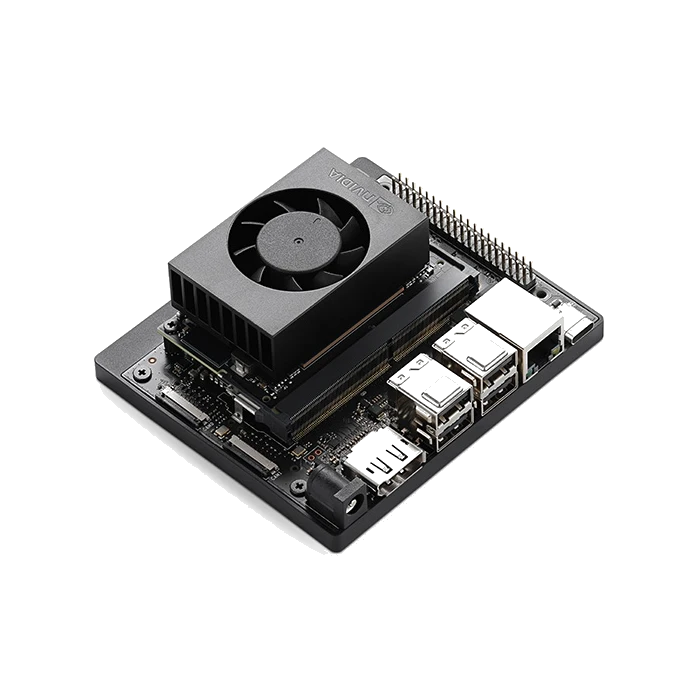
| GPU | 1,024-core Ampere · 32 Tensor cores |
| AI performance | 67 TOPS (INT8, Super) · 40 TOPS base |
| CPU | 6-core Arm Cortex-A78AE |
| Bandwidth | 102 GB/s |
| Power | 7-25 W configurable |
| Status | awaiting hardware |
Specs from NVIDIA. No measurement has been taken on this device. This card is a roadmap placeholder, clearly labeled as future work.
NVIDIA IGX Orin
industrial edge-AI platform. The platform we're building toward — what we are working towards as the next frontier of edge-AI chips and deployments.
No benchmark or test is claimed. Clearly labeled future work.